Fichier:Co2 by country.png

Fichier d’origine (745 × 1 118 pixels, taille du fichier : 55 kio, type MIME : image/png)
Ce fichier et sa description proviennent de Wikimedia Commons.
Description
| Description |
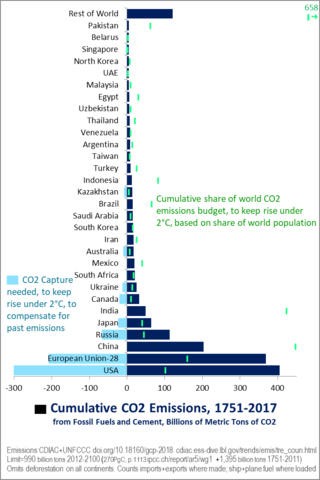
English: Cumulative CO2 Emissions |
| Date | |
| Source | Travail personnel |
| Auteur | Numbersinstitute |
| Autorisation (Réutilisation de ce fichier) |
Ce fichier est sous la licence Creative Commons Attribution – Partage dans les Mêmes Conditions 4.0 International.
|
Data came from multiple sources. The spreadsheet which merged them is stored at http://www.co2list.org/co2since1751.xlsx
- 1959-2017 emissions (except fuel for international ships and planes, bunkers): Global Carbon Project. (2018). Supplemental data of Global Carbon Budget 2018 (Version 1.0) [Data set]. Global Carbon Project. https://doi.org/10.18160/gcp-2018 They say to cite:
- CDIAC data: from Boden, T. A., Marland, G., and Andres, R. J.: Global, Regional, and National Fossil-Fuel CO2 Emissions, Oak Ridge National Laboratory, U.S. Department of Energy, Oak Ridge, Tenn., U.S.A., doi 10.3334/CDIAC/00001_V2017, 2017; available at: http://cdiac.ess-dive.lbl.gov/trends/emis/overview_2014.html
- UNFCCC data: http://unfccc.int/national_reports/annex_i_ghg_inventories/national_inventories_submissions/items/8108.php; accessed June 2018
- 2017 (and for some countries 2015-2017) estimates are preliminary and are based on energy statistics published by BP https://www.bp.com/content/dam/bp/en/corporate/pdf/energy-economics/statistical-review/bp-15stats-review-2018-full-report.pdf
- 1751-1958 total emissions and 1751-2014 bunkers, where available: CDIAC data cited above. CDIAC has old data by historic geographies, such as USSR, United East and West Pakistan, United Korea, Yugoslavia and the Malay Peninsula. These have been allocated to current geography based on the proportions of emissions in the single year after each split, such as 1992 for USSR and Yugoslavia. Pre-1958 emissions are usually small. Bunkers are significant in major ports, such as Singapore, UAE, Netherlands.
- World emissions limit is the sum of two numbers. This total is divided among countries in proportion to their 2017 population.
- 990 billion tons of CO2 which can be emitted in 2012-2100, consistent with 2C global warming. This is given as 270PgC (petagrams of Carbon, or billions of tons of Carbon) on p.1113 of https://ipcc.ch/report/ar5/wg1
- 1,395 billion tons of CO2 emitted 1751-2011, from the same CDIAC and UNFCCC sources given above.
- 2017 Population: UN Population Division, Worlf Population Prospects 2017, Medium Variant, POP/DB/WPP/Rev.2017/POP/F01-1 https://population.un.org/wpp/Download/Standard/Population/
As noted on the graph and table, the emissions include CO2 from burning fossil fuels and from making cement. Therefore they omit methane and other greenhouse gases, and deforestation on all continents. They count imports+exports where they were produced, not where they were consumed, and fuel for international transport where it was loaded.
- If methane were counted where it leaks (primarily at production sites), countries which produce oil and gas would have higher emissions. If methane were counted where the resulting oil or gas is consumed, most countries with high emissions would show even higher emissions.
- If deforestation were counted, it would assign more emissions to countries which have deforested large areas, such as the USA, Europe, Brazil and Indonesia.
- If imports and exports were counted at their destination, more emissions would be assigned to countries with trade deficits, like the USA, and less emissions to countries with trade surpluses, like China.
- To the extent fuels for international transport (bunker fuels) are counted at each end of round trips, they are properly allocated to both countries. To the extent they are counted in between, at a trans-shipment hub, they reflect the country's role as a hub.
| Countries | CO2, Cumulative Total, 1751-2017 | 2017 Population, Millions | Share of Population=Share of Cumulative Emissions Budget, to Hold Rise under 2°C | CO2 Cumulative Emissions Budget | CO2 Capture Needed to Compensate for Past Emissions |
|---|---|---|---|---|---|
| World | 1612 | 7550 | 100.0% | 2385 | |
| USA | 405 | 324 | 4.3% | 103 | -303 |
| European Union-28 | 369 | 509 | 6.7% | 161 | -208 |
| China | 203 | 1418 | 18.8% | 448 | 0 |
| Russia | 113 | 144 | 1.9% | 45 | -67 |
| Japan | 64 | 127 | 1.7% | 40 | -24 |
| India | 49 | 1339 | 17.7% | 423 | 0 |
| Canada | 32 | 37 | 0.5% | 12 | -21 |
| Ukraine | 26 | 44 | 0.6% | 14 | -12 |
| South Africa | 20 | 57 | 0.8% | 18 | -2 |
| Mexico | 19 | 129 | 1.7% | 41 | 0 |
| Australia | 18 | 24 | 0.3% | 8 | -10 |
| Iran | 17 | 81 | 1.1% | 26 | 0 |
| South Korea | 17 | 51 | 0.7% | 16 | 0 |
| Saudi Arabia | 15 | 33 | 0.4% | 10 | -5 |
| Brazil | 15 | 209 | 2.8% | 66 | 0 |
| Kazakhstan | 14 | 18 | 0.2% | 6 | -8 |
| Indonesia | 13 | 264 | 3.5% | 83 | 0 |
| Turkey | 10 | 81 | 1.1% | 26 | 0 |
| Taiwan | 8 | 24 | 0.3% | 7 | -1 |
| Argentina | 8 | 44 | 0.6% | 14 | 0 |
| Venezuela | 8 | 32 | 0.4% | 10 | 0 |
| Thailand | 7 | 69 | 0.9% | 22 | 0 |
| Uzbekistan | 6 | 32 | 0.4% | 10 | 0 |
| Egypt | 6 | 98 | 1.3% | 31 | 0 |
| Malaysia | 5 | 32 | 0.4% | 10 | 0 |
| UAE | 5 | 9 | 0.1% | 3 | -2 |
| North Korea | 5 | 25 | 0.3% | 8 | 0 |
| Singapore | 5 | 6 | 0.1% | 2 | -3 |
| Belarus | 5 | 9 | 0.1% | 3 | -2 |
| Pakistan | 5 | 197 | 2.6% | 62 | 0 |
| Rest of World | 121 | 2083 | 27.6% | 658 | 0 |

|
Cette image (de type graphique) devrait être recréée dans un format vectoriel, en tant que fichier SVG. Cela offrirait plusieurs avantages : voir Commons:Media for cleanup pour plus d'informations. Si une version SVG de cette image est déjà disponible, merci de bien vouloir l'envoyer. Après cela, remplacez ce modèle par {{vector version available|nouveau nom d'image.svg}}.
|
Historique du fichier
Cliquer sur une date et heure pour voir le fichier tel qu'il était à ce moment-là.
| Date et heure | Vignette | Dimensions | Utilisateur | Commentaire | |
|---|---|---|---|---|---|
| actuel | 2 mai 2019 à 23:34 | | 745 × 1 118 (55 kio) | Numbersinstitute | corrected 1750 to 1751, and first citation |
| 30 avril 2019 à 01:50 |  | 745 × 1 089 (55 kio) | Numbersinstitute | Updated to 2017 and added international transport fuels (bunkers) with data compiled by Univ. of Lund from CDIAC and UNFCCC | |
| 19 avril 2019 à 14:01 |  | 746 × 1 089 (53 kio) | Numbersinstitute | clearer colors | |
| 18 avril 2019 à 20:31 |  | 746 × 1 089 (53 kio) | Numbersinstitute | {{Information |description ={{en|1=Cumulative CO2 Emissions}} |date =2019-04-18 |source =Own work |author =User:Numbersinstitute |permission ={{cc-by-sa}} }} |
Utilisation du fichier
La page suivante utilise ce fichier :
Usage global du fichier
Les autres wikis suivants utilisent ce fichier :
- Utilisation sur it.wikipedia.org