Fichier:Evidence of human-induced global warming - patterns of temperature change produced by various atmospheric factors, 1958-1999 (USGCRP).png

Fichier d’origine(907 × 997 pixels, taille du fichier : 597 kio, type MIME : image/png)

Ce fichier et sa description proviennent de Wikimedia Commons.

Description

Description
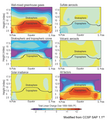
English: From the cited public-domain source - US Global Change Research Program (USGCRP, 2009): "Climate simulations of the vertical profile of temperature change due to various factors, and the effect due to all factors taken together. The panels above represent a cross-section of the atmosphere from the north pole to the south pole, and from the surface up into the stratosphere. The black lines show the location of the tropopause, the boundary between the lower atmosphere (troposphere) and the stratosphere."

This set of climate simulations provides evidence of human-induced climate change. From USGCRP (2009): "Another fingerprint of human effects on climate has been identified by looking at a slice through the layers of the atmosphere, and studying the pattern of temperature changes from the surface up through the stratosphere. In all climate models, increases in carbon dioxide cause warming at the surface and in the troposphere, but lead to cooling of the stratosphere. For straightforward physical reasons, models also calculate that the human-caused depletion of stratospheric ozone has had a strong cooling effect in the stratosphere. There is a good match between the model fingerprint in response to combined carbon dioxide and ozone changes and the observed pattern of tropospheric warming and stratospheric cooling [...]

In contrast, if most of the observed temperature change had been due to an increase in solar output rather than an increase in greenhouse gases, Earth’s atmosphere would have warmed throughout its full vertical extent, including the stratosphere [...] The observed pattern of atmospheric temperature changes, with its pronounced cooling in the stratosphere, is therefore inconsistent with the hypothesis that changes in the Sun can explain the warming of recent decades. Moreover, direct satellite measurements of solar output show slight decreases during the recent period of warming."

References: More details about this image can be found in the following publication: Ramaswamy, V., et al., 2006: Figure 1.3, in: Chapter 1: Why do temperatures vary vertically (from the surface to the stratosphere) and what do we understand about why they might vary and change over time? in: Temperature Trends in the Lower Atmosphere: Steps for Understanding and Reconciling Differences (Karl, T.R., et al., (eds.)). Synthesis and Assessment Product 1.1, U.S. Climate Change Science Program, Washington, DC, p.25.
Date
Source USGCRP: Karl, T.R., et al. (eds): Global Climate Change in the United States: Global Climate Change: Patterns of Temperature Change Produced by Various Atmospheric Factors, 1958-1999. Cambridge University Press. The image can also be viewed as part of the USGCRP image gallery: Global Climate Change Impacts in the United States: Chapter 1: Global Climate Change: Global Climate Change_8 (download).
Auteur USGCRP
Autorisation
(Réutilisation de ce fichier)
From the cited USGCRP (2009) report (page 4 of PDF): "This report was produced by an advisory committee chartered under the Federal Advisory Committee Act, for the Subcommittee on Global Change Research, and at the request of the U.S. Government. Therefore, the report is in the public domain [...]" The USGCRP image gallery also states: "The images available in the globalchange.gov image gallery are not copyrighted by the USGCRP; they may, therefore, be used for educational, instructional, or personal uses as is seen fit. The only exception to this rule pertains to the logos of the USGCRP and Climate Change Science Program -- these images may be used solely for the business of their respective organization.

If any images below are used, then credit must be given to the USGCRP through the form of a caption, such as: "Image credit: U.S. Global Change Research Program (www.globalchange.gov)." In addition, if the image is being used on a webpage, then there must be a hyperlink directing the reader to www.globalchange.gov."

Conditions d’utilisation

Public domain
Ce média est dans le domaine public des États-Unis d’Amérique car son auteur est l’administration américaine comme précisé dans le code fédéral au Titre 17, Chapitre 1, Section 105. Pour en savoir plus : droit d’auteur. Attention : Ceci ne concerne que le travail du Gouvernement Fédéral et pas celui des États, ou d’une autre subdivision géographique ou politique du pays.

Légendes

Ajoutez en une ligne la description de ce que représente ce fichier

Éléments décrits dans ce fichier

dépeint

Historique du fichier

Cliquer sur une date et heure pour voir le fichier tel qu'il était à ce moment-là.

Date et heureVignetteDimensionsUtilisateurCommentaire
actuel12 août 2012 à 19:57Vignette pour la version du 12 août 2012 à 19:57907 × 997 (597 kio)Enescot{{Information |Description ={{en|1=From the cited public-domain source - US Global Change Research Program (USGCRP, 2009): "Climate simulations of the vertical profile of temperature change due to various factors, and the effect due to all factors t...

Les 2 pages suivantes utilisent ce fichier :

Usage global du fichier

Métadonnées