Fichier:Gaia’s Hertzsprung-Russell diagram ESA393151.jpg

Fichier d’origine (2 480 × 3 754 pixels, taille du fichier : 1,46 Mio, type MIME : image/jpeg)
Ce fichier et sa description proviennent de Wikimedia Commons.


Description
| Description |
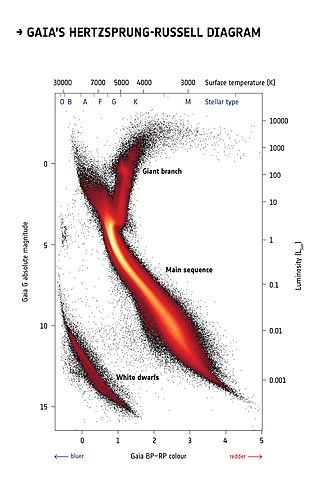
English: More than four million stars within five thousand light-years from the Sun are plotted on this diagram using information about their brightness, colour and distance from the second data release from ESA’s Gaia satellite. It is known as a Hertzsprung-Russell diagram after the astronomers who devised it in the early 20th century, and it is a fundamental tool to study populations of stars and their evolution.
This Hertzsprung-Russell diagram, obtained by a selection of stars in Gaia’s second release catalogue, is the most detailed to date made by mapping stars over the entire sky, containing roughly a hundred times more stars thanthe one obtained using data from ESA’s Hipparcos mission, the predecessor of Gaia, in the 1990s. This new diagram contains so much highly accurate information that astronomers have been able to identify fine details that were never before seen. The Hertzsprung-Russell diagram can be imagined as a stellar family portrait: stars are plotted according to their colour (on the horizontal axis) and brightness (on the vertical axis) and are grouped in different regions of the diagram depending mainly on their masses, chemical composition, ages, and stages in the stellar life cycle. Information about stellar distances is fundamental to calculate the true brightness, or absolute magnitude, of stars. Brighter stars are shown in the top part of the diagram, while fainter stars are in the lower part. Bluer stars, which have hotter surfaces, are on the left, and redder stars, with cooler surfaces, on the right. The colour scale in this image does not represent the colour of stars but is a representation of how many stars are plotted in each portion of the diagram: black represents lower numbers of stars, while red, orange and yellow correspond to increasingly higher numbers of stars. The large diagonal stripe across the centre of the graph is known as the main sequence. This is where fully-fledged stars that are generating energy by fusing hydrogen into helium are found. Massive stars, which have bluer or whiter colours, are found in the upper left end of the main sequence, while intermediate-mass stars like our Sun, characterised by yellow colours, are located mid-way. Redder, low-mass stars are found towards the lower right. As stars age they swell up, becoming brighter and redder. Stars experiencing this are shown on the diagram as the vertical arm leading off the main sequence and turning to the right. This is known as the red giant branch. While the most massive stars swell into red giants and explode as powerful supernovae, stars like our Sun end their days in a less spectacular fashion, eventually turning into white dwarfs – the hot cores of dead stars. These are found in the lower left of the diagram. The huge leap forward from Hipparcos to Gaia is especially visible in thewhite dwarf region of the diagram. While Hipparcos had obtained reliable distance measurements to only a handful of white dwarfs, more than 35 000 such objects are included in this diagram based on Gaia data. This allows astronomers to see the signature of different types of white dwarfs such that a differentiation can be made between those with hydrogen-rich cores and those dominated by helium. Acknowledgement: Gaia Data Processing and Analysis Consortium (DPAC); Carine Babusiaux, IPAG – Université Grenoble Alpes, GEPI – Observatoire de Paris, France. |
| Date | |
| Source | http://www.esa.int/spaceinimages/Images/2018/04/Gaia_s_Hertzsprung-Russell_diagram |
| Auteur | European Space Agency |
| Autorisation (Réutilisation de ce fichier) |
ESA/Gaia/DPAC,CC BY-SA 3.0 IGO |
| Title | Gaia’s Hertzsprung-Russell diagram |
| Mission | Gaia |
| Activity | Space Science |
Conditions d’utilisation
- Vous êtes libre :
- de partager – de copier, distribuer et transmettre cette œuvre
- d’adapter – de modifier cette œuvre
- Sous les conditions suivantes :
- paternité – Vous devez donner les informations appropriées concernant l'auteur, fournir un lien vers la licence et indiquer si des modifications ont été faites. Vous pouvez faire cela par tout moyen raisonnable, mais en aucune façon suggérant que l’auteur vous soutient ou approuve l’utilisation que vous en faites.
- partage à l’identique – Si vous modifiez, transformez, ou vous basez sur cette œuvre, vous devez distribuer votre contribution sous la même licence ou une licence compatible avec celle de l’original.
Historique du fichier
Cliquer sur une date et heure pour voir le fichier tel qu'il était à ce moment-là.
| Date et heure | Vignette | Dimensions | Utilisateur | Commentaire | |
|---|---|---|---|---|---|
| actuel | 3 avril 2019 à 16:05 | | 2 480 × 3 754 (1,46 Mio) | Fæ | European Space Agency, Id 393151, http://www.esa.int/spaceinimages/Images/2018/04/Gaia_s_Hertzsprung-Russell_diagram, User:Fæ/Project_list/ESA |
Utilisation du fichier
La page suivante utilise ce fichier :
Usage global du fichier
Les autres wikis suivants utilisent ce fichier :
- Utilisation sur ar.wikipedia.org
- Utilisation sur de.wikipedia.org
- Utilisation sur en.wikipedia.org
- Utilisation sur ru.wikipedia.org
- Utilisation sur uk.wikipedia.org
- Utilisation sur zh.wikipedia.org