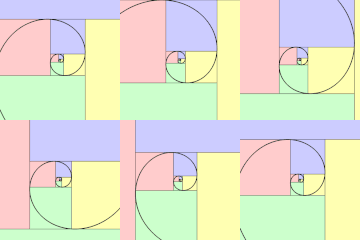
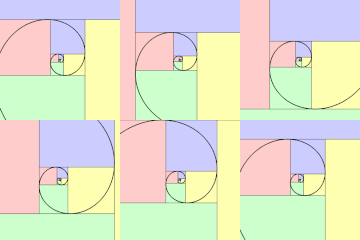
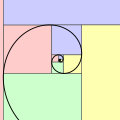
Fichier:GoldenSpiralLogarithmic color in.gif
GoldenSpiralLogarithmic_color_in.gif (450 × 450 pixels, taille du fichier : 1,51 Mio, type MIME : image/gif, en boucle, 245 trames, 4,9 s)
Ce fichier et sa description proviennent de Wikimedia Commons.
Description
| DescriptionGoldenSpiralLogarithmic color in.gif |
English: Logarithmic golden spiral |
| Date | |
| Source | Travail personnel |
| Auteur | Jahobr |
| Autres versions |
|
| GIF information InfoField | |
| Code source InfoField | MATLAB codefunction GoldenSpiralLogarithmic()
% source code for drawings the animations
%
% 2018-06-07 Jahobr
fps = 50;
nFrames = 245;
xySize = 450; % gif size in pixel
scaleReduction = 2; % the size reduction: adds antialiasing
[pathstr,fname] = fileparts(which(mfilename)); % save files under the same name and at file location
figHandle = figure(2324455);
clf
axesHandle = axes;
hold(axesHandle,'on')
set(figHandle, 'Units','pixel');
set(figHandle, 'position',[1 1 xySize*scaleReduction xySize*scaleReduction]); % big start image for antialiasing later [x y width height]
set(figHandle, 'GraphicsSmoothing','on') % requires at least version 2014b
set(axesHandle,'position',[-0.05 -0.05 1.1 1.1]); % stretch axis bigger as figure, easy way to get rid of ticks [x y width height]
axis equal; drawnow;
phi = (1+sqrt(5))/2;
b = log(phi)/(pi/2);
thetaXextreme = atan(b)+pi/2*(2:-2:-20);
rXextreme = phi.^(thetaXextreme*2/pi);
[Xextreme,yXext] = pol2cart(thetaXextreme,rXextreme);
thetaYextreme = atan(b)+pi/2*(1:-2:-21);
rYextreme = phi.^(thetaYextreme*2/pi);
[xYext,Yextreme] = pol2cart(thetaYextreme,rYextreme);
theta = pi/2*(3:-0.02:-20); % curve points
r = phi.^(theta*2/pi); % radii
[X,Y] = pol2cart(theta,r); % cartesian coordinate system
for useColor = [false true]
cla(axesHandle);
for m = 1:numel(Xextreme)-2
if useColor
cmap = [0.0 0.0 0.0;... 1 spiral color; black
0.3 0.3 0.3;... 2 box-edge color; grey
1.0 0.8 0.8;... 3 box-filling; pale red
1.0 1.0 0.7;... 4 box-filling; pale yellow
0.8 1.0 0.8;... 5 box-filling; pale green
0.8 0.8 1.0]; % 6 box-filling; pale blue
cmap = round(cmap.*255)./255; % round to uint8 positions
curVers = '_color';
if Xextreme(m)<0
colFilling = cmap(3,:); % pale red
else
colFilling = cmap(4,:); % pale yellow
end
patch([Xextreme(m) Xextreme(m) Xextreme(m+2) Xextreme(m+2) Xextreme(m)],...
[ Yextreme(m+1) Yextreme(m) Yextreme(m) Yextreme(m+1) Yextreme(m+1)],...
colFilling,'EdgeColor',cmap(2,:),'LineWidth',3)
if Yextreme(m)<0
colFilling = cmap(5,:); % pale green
else
colFilling = cmap(6,:); % pale blue
end
patch([Xextreme(m+2) Xextreme(m+2) Xextreme(m+1) Xextreme(m+1) Xextreme(m+2)],...
[ Yextreme(m+2) Yextreme(m) Yextreme(m) Yextreme(m+2) Yextreme(m+2)],...
colFilling,'EdgeColor',cmap(2,:),'LineWidth',3)
else
cmap = [0.0 0.0 1.0;... 1 spiral color; blue
0.0 0.0 0.0;... 2 box-edge color; black
1.0 1.0 1.0]; % 3 box-filling; white
cmap = round(cmap.*255)./255; % round to uint8 positions
curVers = '';
plot([Xextreme(m) Xextreme(m) Xextreme(m+2) Xextreme(m+2) Xextreme(m)],...
[ Yextreme(m+1) Yextreme(m) Yextreme(m) Yextreme(m+1) Yextreme(m+1)],...
'-','color',cmap(2,:),'LineWidth',3)
plot([Xextreme(m+2) Xextreme(m+2) Xextreme(m+1) Xextreme(m+1) Xextreme(m+2)],...
[ Yextreme(m+2) Yextreme(m) Yextreme(m) Yextreme(m+2) Yextreme(m+2)],...
'-','color',cmap(2,:),'LineWidth',3)
end
end
plot(X,Y,'.-','linewidth',5,'color',cmap(1,:),'Markersize',5*3.4) % plot spiral
scale = linspace(log(-Xextreme(3)),log(-Xextreme(5)),nFrames+1); % start with an area fully covered, zoom in till repetition
scale = exp(scale); % logarithmic sale
scale = scale(1:end-1); % cut off doubled frame
RGBimageStack = uint8(ones(xySize*scaleReduction,xySize*scaleReduction,3,nFrames)); % allocate
for iFrame = 1:nFrames
axis equal
xlim([-scale(iFrame) scale(iFrame)]) % zoom
ylim([-scale(iFrame) scale(iFrame)]) % zoom
drawnow expose; % causes graphics and user-interface objects to refresh with all pending changes
% save SVG
if iFrame == 1 % only once
if ~isempty(which('plot2svg'))
posSave = get(figHandle, 'position');
set(figHandle, 'position',[1 1 800 800]); % big start image for antialiasing later [x y width height]
plot2svg(fullfile(pathstr, [fname curVers '.svg']),figHandle) % by Juerg Schwizer
set(figHandle, 'position',posSave); % reset size
set(axesHandle,'position',[-0.05 -0.05 1.1 1.1]); % stretch axis bigger as figure, easy way to get rid of ticks [x y width height]
else
disp('plot2svg.m not available; see http://www.zhinst.com/blogs/schwizer/');
end
end
%% save animation
f = getframe(figHandle);
RGBimageStack(:,:,:,iFrame) = f.cdata; % store
end
reducedRGBimage = imReduceSize(RGBimageStack,scaleReduction); % the size reduction: adds better antialiasing
map = createImMap(reducedRGBimage,32,cmap); % colormap
im = uint8(ones(xySize,xySize,1,nFrames)); % allocate colormap indexed image
for iFrame = 1:nFrames
im(:,:,1,iFrame) = rgb2ind(reducedRGBimage(:,:,:,iFrame),map,'nodither'); % RGB to colormap indexed image
end
imwrite(im,map,fullfile(pathstr, [fname curVers '_in.gif']),'DelayTime',1/fps,'LoopCount',inf) % save gif
disp([fname curVers '_in.gif has ' num2str(numel(im)/10^6 ,4) ' Megapixels']) % Category:Animated GIF files exceeding the 50 MP limit
imwrite(im(:,:,:,iFrame:-1:1),map,fullfile(pathstr, [fname curVers '_out.gif']),'DelayTime',1/fps,'LoopCount',inf) % save gif
%% save MP4 and WebM
cd(pathstr); % set path to working folder
videoFileName = [fname curVers '_in'];
vid = VideoWriter(videoFileName,'MPEG-4'); % Prepare the new file
vid.FrameRate = fps;
vid.Quality = 100; % quality in [0% 100%]
open(vid);
for iRep = 1:5 % loops
for iFrame = 1:nFrames
writeVideo(vid,RGBimageStack(:,:,:,iFrame));
end
end
close(vid); %
disp('conversion from MP4 to WebM (Matlab currently does not support webm)');
try
dosCommand = ['!ffmpeg -i ' videoFileName '.mp4 '... % Command and source
'-c:v libvpx-vp9 -crf 30 -b:v 0 -deadline best '...% constant (best) quality; see: https://trac.ffmpeg.org/wiki/Encode/VP9
videoFileName '.webm']; % conversion target
eval(dosCommand); % run conversion from mp4 to webm
catch
disp(['"ffmpeg.exe" not available in path "' pathstr '" (or other problem); see https://ffmpeg.zeranoe.com/builds/']);
end
end
function im = imReduceSize(im,redSize)
% Input:
% im: image, [imRows x imColumns x nChannel x nStack] (unit8)
% imRows, imColumns: must be divisible by redSize
% nChannel: usually 3 (RGB) or 1 (grey)
% nStack: number of stacked images
% usually 1; >1 for animations
% redSize: 2 = half the size (quarter of pixels)
% 3 = third the size (ninth of pixels)
% ... and so on
% Output:
% imNew: unit8([imRows/redSize x imColumns/redSize x nChannel x nStack])
%
% an alternative is : imNew = imresize(im,1/reduceImage,'bilinear');
% BUT 'bicubic' & 'bilinear' produces fuzzy lines
% IMHO this function produces nicer results as "imresize"
[nRow,nCol,nChannel,nStack] = size(im);
if redSize==1; return; end % nothing to do
if redSize~=round(abs(redSize)); error('"redSize" must be a positive integer'); end
if rem(nRow,redSize)~=0; error('number of pixel-rows must be a multiple of "redSize"'); end
if rem(nCol,redSize)~=0; error('number of pixel-columns must be a multiple of "redSize"'); end
nRowNew = nRow/redSize;
nColNew = nCol/redSize;
im = double(im).^2; % brightness rescaling from "linear to the human eye" to the "physics domain"; see youtube: /watch?v=LKnqECcg6Gw
im = reshape(im, nRow, redSize, nColNew*nChannel*nStack); % packets of width redSize, as columns next to each other
im = sum(im,2); % sum in all rows. Size of result: [nRow, 1, nColNew*nChannel]
im = permute(im, [3,1,2,4]); % move singleton-dimension-2 to dimension-3; transpose image. Size of result: [nColNew*nChannel, nRow, 1]
im = reshape(im, nColNew*nChannel*nStack, redSize, nRowNew); % packets of width redSize, as columns next to each other
im = sum(im,2); % sum in all rows. Size of result: [nColNew*nChannel, 1, nRowNew]
im = permute(im, [3,1,2,4]); % move singleton-dimension-2 to dimension-3; transpose image back. Size of result: [nRowNew, nColNew*nChannel, 1]
im = reshape(im, nRowNew, nColNew, nChannel, nStack); % putting all channels (rgb) back behind each other in the third dimension
im = uint8(sqrt(im./redSize^2)); % mean; re-normalize brightness: "scale linear to the human eye"; back in uint8
function map = createImMap(imRGB,nCol,startMap)
% createImMap creates a color-map including predefined colors.
% "rgb2ind" creates a map but there is no option to predefine some colors,
% and it does not handle stacked images.
% Input:
% imRGB: image, [imRows x imColumns x 3(RGB) x nStack] (unit8)
% nCol: total number of colors the map should have, [integer]
% startMap: predefined colors; colormap format, [p x 3] (double)
imRGB = permute(imRGB,[1 2 4 3]); % step1; make unified column-image (handling possible nStack)
imRGBcolumn = reshape(imRGB,[],1,3,1); % step2; make unified column-image
fullMap = double(permute(imRGBcolumn,[1 3 2]))./255; % "column image" to color map
[fullMap,~,imMapColumn] = unique(fullMap,'rows'); % find all unique colores; create indexed colormap-image
% "cmunique" could be used but is buggy and inconvenient because the output changes between "uint8" and "double"
nColFul = size(fullMap,1);
nColStart = size(startMap,1);
disp(['Number of colors: ' num2str(nColFul) ' (including ' num2str(nColStart) ' self defined)']);
if nCol<=nColStart; error('Not enough colors'); end
if nCol>nColFul; warning('More colors than needed'); end
isPreDefCol = false(size(imMapColumn)); % init
for iCol = 1:nColStart
diff = sum(abs(fullMap-repmat(startMap(iCol,:),nColFul,1)),2); % difference between a predefined and all colores
[mDiff,index] = min(diff); % find matching (or most similar) color
if mDiff>0.05 % color handling is not precise
warning(['Predefined color ' num2str(iCol) ' does not appear in image'])
continue
end
isThisPreDefCol = imMapColumn==index; % find all pixel with predefined color
disp([num2str(sum(isThisPreDefCol(:))) ' pixel have predefined color ' num2str(iCol)]);
isPreDefCol = or(isPreDefCol,isThisPreDefCol); % combine with overall list
end
[~,mapAdditional] = rgb2ind(imRGBcolumn(~isPreDefCol,:,:),nCol-nColStart,'nodither'); % create map of remaining colors
map = [startMap;mapAdditional];
|
Conditions d’utilisation
Moi, en tant que détenteur des droits d’auteur sur cette œuvre, je la publie sous la licence suivante :
| Ce fichier est dans le domaine public selon les termes de la licence Creative Commons CC0 1.0 Universel. | |
| La personne qui a associé une œuvre avec cet acte l’a placée dans le domaine public en renonçant mondialement à tous ses droits sur cette œuvre en vertu des lois relatives au droit d’auteur, ainsi qu’à tous les droits juridiques connexes et voisins qu’elle possédait sur l’œuvre, sans autre limite que celles imposées par la loi. Vous pouvez copier, modifier, distribuer et utiliser cette œuvre, y compris à des fins commerciales, sans qu’il soit nécessaire d’en demander la permission.
http://creativecommons.org/publicdomain/zero/1.0/deed.enCC0Creative Commons Zero, Public Domain Dedicationfalsefalse |
Légendes
Ajoutez en une ligne la description de ce que représente ce fichier
A golden spiral...
Éléments décrits dans ce fichier
dépeint
Valeur sans élément de Wikidata
3 mai 2017
image/gif
Historique du fichier
Cliquer sur une date et heure pour voir le fichier tel qu'il était à ce moment-là.
| Date et heure | Vignette | Dimensions | Utilisateur | Commentaire | |
|---|---|---|---|---|---|
| actuel | 7 octobre 2017 à 20:47 |  | 450 × 450 (1,51 Mio) | Jahobr | 'GraphicsSmoothing','on' + code update |
| 2 mai 2017 à 23:15 |  | 450 × 450 (1,47 Mio) | Jahobr | User created page with UploadWizard |
Utilisation du fichier
La page suivante utilise ce fichier :
Usage global du fichier
Les autres wikis suivants utilisent ce fichier :
- Utilisation sur ckb.wikipedia.org
- Utilisation sur de.wikipedia.org
- Utilisation sur en.wikipedia.org
- Utilisation sur en.wiktionary.org
- Utilisation sur es.wikipedia.org
- Utilisation sur gl.wikipedia.org
- Utilisation sur sl.wikipedia.org
- Utilisation sur uk.wikipedia.org
- Utilisation sur uz.wikipedia.org
Ce document provient de « https://fr.wikipedia.org/wiki/Fichier:GoldenSpiralLogarithmic_color_in.gif ».


