bar:'name:Puits_Saint-Louis' from:1810 till:1842
bar:'name:Puits_Henri-IV' from:1815 till:1835
bar:'name:Puits_Samson' from:1822 till:1824
bar:'name:Puits_no 1' from:1825 till:1833
bar:'name:Puits_no 2' from:1825 till:1833
bar:'name:Puits_no 3' from:1825 till:1828
bar:'name:Puits_no 4' from:1829 till:1830
bar:'name:Puits_no 5' from:1830 till:1832
bar:'name:Puits_no 6' from:1832 till:1836
bar:'name:Puits_no 7' from:1839 till:1872
bar:'name:Puits_Saint-Charles_/_no 8' from:1845 till:1895
bar:'name:Puits_de-la-Croix' from:1849 till:1891
bar:'name:Puits_Saint-Joseph' from:1850 till:1895
bar:'name:Puits_Saint-Jean' from:1854 till:1856
bar:'name:Puits_Sainte-Pauline' from:1854 till:1884
bar:'name:Puits_Sainte-Barbe' from:1854 till:1872
bar:'name:Puits_de_l'Espérance' from:1855 till:1873
bar:'name:Puits_Notre-Dame' from:1851 till:1896
bar:'name:Puits_Sainte-Marie' from:1863 till:1896
bar:'name:Puits_Saint-Georges' from:1866 till:1873
bar:'name:Puits_Saint-Paul' from:1873 till:1882
bar:'name:Puits_du_Chanois' from:1873 till:1951
bar:'name:Puits_du_Magny' from:1873 till:1958
bar:'name:Puits_du_Tonnet_/_no 9' from:1883 till:1954
bar:'name:Puits_no 10' from:1884 till:1958
bar:'name:Puits_Arthur-de-Buyer_/_no 11' from:1894 till:1954
bar:'name:Puits_de_l_Étançon_/_no 13_bis' from:1949 till:1958
Selon la Genèse, les tombeaux des patriarches se trouvent à Hébron.
Ce tableau reflète le texte massorétique. Les chiffres donnés par d'autres versions, comme la Septante ou le Pentateuque samaritain, sont très différents[1].
Longévité des patriarches
Cette représentation chronologique commence à la création du monde selon la Bible. Son échelle est en années. En l’absence de référence biblique,
la naissance d’un patriarche est placée 30 ans après celle de son père ou 100 ans après celle du précédent patriarche.
https://www.federationsump.org/horde/drupal/UserFiles/images/bonnes%20initiatives/GUIDE-LSD.pdf
première ligne en bleu puis red puis ...
modifier
| Candidat
|
Min
|
Max
|
| %
|
Département
|
%
|
Département
|
|
|
Eva Joly |
1,16 |
Aisne |
4,18 |
Paris
|
|
|
Marine Le Pen |
6,20 |
Paris |
27,03 |
Vaucluse
|
|
|
Nicolas Sarkozy |
18,72 |
Ariège |
37,19 |
Alpes-Maritimes
|
|
|
Jean-Luc Mélenchon |
7,22 |
Bas-Rhin |
16,99 |
Seine-Saint-Denis
|
|
|
Philippe Poutou |
0,67 |
Paris |
1,73 |
Pyrénées-Atlantiques
|
|
|
Nathalie Arthaud |
0,27 |
Paris |
0,89 |
Somme
|
|
|
Jacques Cheminade |
0,18 |
Corrèze |
0,33 |
Haut-Rhin
|
|
|
François Bayrou |
4,60 |
Haute-Corse |
15,67 |
Pyrénées-Atlantiques
|
|
|
Nicolas Dupont-Aignan |
1,00 |
Paris |
3,41 |
Essonne
|
|
|
François Hollande |
18,89 |
Haut-Rhin |
42,97 |
Corrèze
|
Onderstaande figuur toont het verloop van het inwonertal (bron: INSEE-tellingen).
| a |
b |
c |
d
|
| a |
b |
c |
d |
| a |
b |
c |
d |
| a |
b |
c |
d |
| a |
b |
c |
d |
| a |
b |
c |
d |
| a |
b |
c |
d
|
| a |
b |
c |
d |
| a |
b |
c |
d |
| a |
b |
c |
d |
| a |
b |
c |
d |
| a |
b |
c |
d
|
| a |
b |
c |
d |
| a |
b |
c |
d |
| a |
b |
c |
d |
| a |
b |
c |
d |
| a |
b |
c |
d
|
| a |
b |
c |
d |
| a |
b |
c |
d |
| a |
b |
c |
d |
| a |
b |
c |
d |
| a |
b |
c |
d
|
| a |
b |
c |
d |
| a |
b |
c |
d |
| a |
b |
c |
d |
| a |
b |
c |
d |
| a |
b |
c |
d
|
| a |
b |
c |
d |
| a |
b |
c |
d |
| a |
b |
c |
d |
| a |
b |
c |
d |
| a |
b |
c |
d
|
| a |
b |
c |
d |
| a |
b |
c |
d |
| a |
b |
c |
d |
| a |
b |
c |
d |
| a |
b |
c |
d
|
| a |
b |
c |
d |
| a |
b |
c |
d |
| a |
b |
c |
d |
| a |
b |
c |
d |
| essai |
essai |
essai |
essai
|
| a |
essai |
c |
d |
| a |
b |
c |
d |
| a |
b |
c |
d |
| a |
b |
c |
d |
| autre essai |
autre essai |
autre essai |
autre essai
|
| autre essai |
autre essai |
autre essai |
autre essai |
| autre essai |
autre essai |
autre essai |
autre essai |
| autre essai |
autre essai |
autre essai |
autre essai |
| autre essai |
autre essai |
autre essai |
autre essai |
Légende
| Titre |
Titre
|
| ceci est un essai |
Élément
|
| Élément |
Élément
|
| Élément |
Élément
|
| Élément |
Élément
|
- étudier le champ border
- tirer les conclusions de ces essais
- étudier le champ border
- tirer les conclusions de ces essais
- revoir la notice


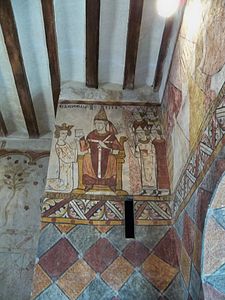
 In situ : investiture de Charles d'Anjou, comte de Provence par Clément IV
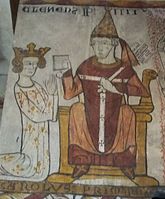 Détail : Charles 1er et Clément IV
 Détail :Clément IV et sa Cour pontificale


 In situ : investiture de Charles d'Anjou, comte de Provence par Clément IV
 Détail : Charles 1er et Clément IV
 Détail :Clément IV et sa Cour pontificale